

OFWAT 2020 Price Review signals greater transparency
Posted on: January 2018Allan Lambert, Open Access Leakssuite
 |
Allan Lambert, IWA Fellow and founder of the Open Access LEAKSSuite website |
It seems that everyone in the UK has an opinion on leakage from public water supply systems – usually that it is ‘wasteful’, ‘too high’; or ‘more should be done’ – but how does perception compare with reality? Is this ‘group-think’ or is it based on logical analysis of factual data, using international ‘fit for purpose’ performance comparisons? Is there any widely accepted international minimum achievable leakage level, and if so, how is it calculated?
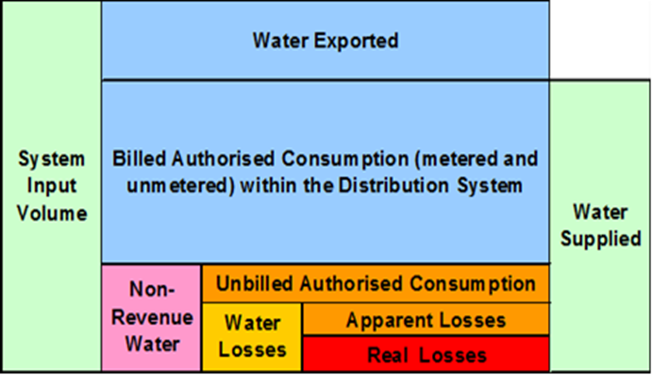
International terms used to calculate leakage from a water balance are shown in Figure 1.
- Non-Revenue Water NRW is calculated as System Input Volume minus Water Exported minus Billed Authorised Consumption.
- Water Losses = NRW minus Unbilled Authorised Consumption (fire fighting, flushing …)
- Apparent Losses consists of unauthorised consumption and customer metering errors
- Real Losses (leakage) = Water Losses minus Apparent Losses
Figure 1: International Water Association (IWA) standard annual water balance (simplified)
Leakage is water lost from by leaks, bursts and overflows up to the point of customer metering; it is the only component of the Water Balance that is not already consumed. As the UK has many unmetered properties, leakage is also assessed from minimum night flow analysis. The two assessments are then reduced to a single figure using a statistical process called Maximum Likelihood Estimation (MLE).
Did you know: around one quarter of annual leakage volume attributed to UK Companies actually occurs on customers’ private underground supply pipes. Meters installed at the street boundary allow faster identification and repair of these underground leaks; meters installed in the property don’t.
Fit for purpose Performance Indicators
Several key performance indicators (KPIs) have been used to compare or track leakage management performance. Unsurprisingly, they give different answers. Users tend to favour the KPI showing them in the best light, or supporting the point of view they seek to promote. Table 1 shows how many key drivers of annual leakage each KPI takes into account (or omits).
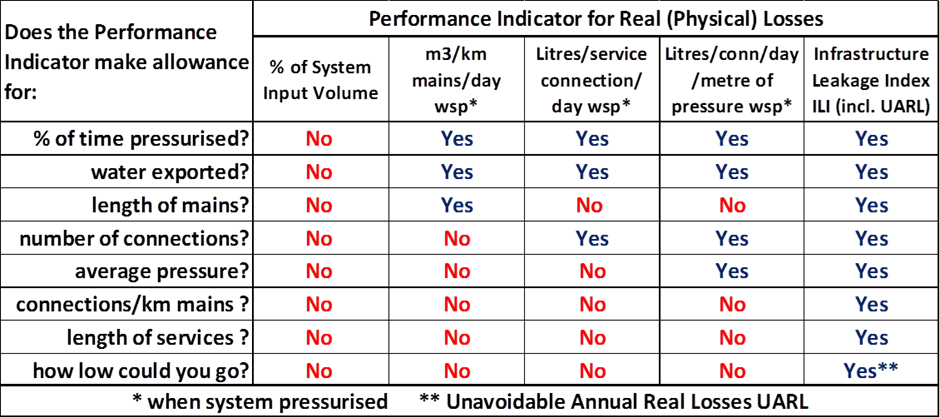
% of System Input Volume (SIV) doesn’t allow for any of the key drivers of leakage volume, and is strongly influenced by changes in consumption. OFWAT recognised this problem and stopped using % of SIV as a KPI for leakage 20 years ago. Consumer Council for Water (CCW) resurrected this measure in ‘Delving into Water 2015’, and hit the same problem – some Utilities reduced leakage volume but their % of SIV increased, others had increased leakage volume but their %s of SIV reduced, resulting in a confusing set of statistics, see (http://www.leakssuite.com/interpreting-leakage-in-england-wales/). How does this anomaly occur?
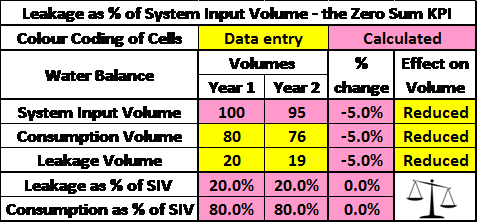
Total Consumption as % of SIV, and leakage as a % of SIV, are a ‘Zero Sum’ calculation which must always total 100% of SIV. Any % fall in one must result in the same % rise in the other. Both cannot reduce in the same year, and leakage % of SIV will rise and fall inversely with changes in consumption, even when leakage volume is unchanged. These are unacceptable failings in a water loss KPI when a country is trying to stimulate reductions in both leakage and consumption at the same time. If you don’t believe this, create your own Table 2, ‘play the percentage game’, and try to achieve reductions in both consumption and leakage, as both % of their previous volume and % of SIV, for any combination of water balance data.
Table 2: Play the % game: try to reduce both leakage & consumption, as % reduction in volume and change in % of SIV (Data entry in yellow, calculated values in pink)
Click here for percent SIV interactive sheet
Zero-sum is not the only problem associated with using % of SIV as a KPI for leakage or NRW, and water professionals internationally continue to abandon using this KPI as highlighted here. http://www.leakssuite.com/kpis-fit-for-purpose/pros-abandon-percents-of-siv/. Why don’t you join them?
Leakage per km, per service connection and per property
The concept of ‘Fit for Purpose’ KPIs recognises that a particular KPI can be excellent for one purpose, but not necessarily for another. In Table 1, litres/service connection/day or m3/km of mains/day are both excellent for tracking changes in leakage and NRW in individual systems; rational choice should depend on whether the majority of annual leakage occurs on the mains or the service connections (generally if more than 20 connections/km). However, these KPIs are not really appropriate for comparing performance in different UK systems with widely different key characteristics. For example, in the UK, average pressure ranges from 2.5 to 5 bar (25 to 50 metres); average service connections/km of mains ranges from 40 to 100; average length of service connections ranges from 10 to 20 metres. And international ranges are even wider.
Currently, UK Company leakage (which includes leakage on private underground supply pipes) is published as volume/year, litres/property/day and m3/km mains/day. These statistics show relative progress of each Utility year on year, but do not permit rational national and international comparisons of technical leakage management performance.
Did you know: in most UK systems, component analysis of leaks (frequency, flow rate, duration) shows the majority of annual leakage volume occurs from long-running service connection leaks, not from visible mains bursts. Leak flow rates vary approximately linearly with average pressure, and burst frequencies on mains and services can be very sensitive to maximum pressure
Unavoidable Annual Real Losses UARL
Because none of the traditional KPIs were suitable for technical comparisons of leakage, an IWA Water Loss Task Force (1995-99) developed a system-specific equation for Unavoidable Annual Real Losses (UARL) (http://www.leakssuite.com/concepts/uarl-and-ili/). The UARL equation provides an auditable estimate of the lowest technically achievable leakage volume for the physical parameters (mains length, number and length of service connections) of any given system at a stated average pressure, and UARL varies linearly with pressure. The OFWAT 2020 Price Review (December 2017) considers that economic leakage levels are not challenging enough, and that in addition to other stretching commitments to reduce leakage, companies should justify their performance commitments relative to the UARL.
International Perspective
Infrastructure Leakage Index (ILI) is the ratio of Current Annual Real Losses to UARL, and provides a level playing field for national and international comparisons of technical leakage management performance at their current operating pressure.
ILIs are now widely adopted internationally (http://www.leakssuite.com/global-ilis/) and can be categorised in international Leakage Performance Categories A to D. The 2015 EU Reference Document on Good Practices on Leakage Management Good Practices on Leakage Management – Main Report_Final.pdf also endorses UARL and ILI. Of nine England/Wales Utilities providing ILIs anonymously to a 2012 European ILI data set, all but one were in group A. All UK Companies already know (or can calculate) their ILI, but few choose to quote this KPI publicly. With OFWAT now requiring Companies to calculate their UARL, national and international comparisons of UK technical leakage performance using ILI will soon be possible.
Although pressure is a key driver of leak flow rates and frequency of leaks and bursts, OFWAT has, surprisingly, never required Utilities to publish or make available their average pressure range. However, this parameter will be needed for calculation of UARL. Reduction of excess pressures and damaging pressure transients has been widely used by UK Companies for over 35 years, without any published information on how average pressures have reduced in this period, or the role that further pressure management could play in reducing leakage still further.
The Water Efficiency (WATEF) Network
©2026 All rights reserved
Website design by